How to Use Technical Analysis for Crypto Trading
- Understanding the basics of technical analysis
- Key technical indicators to consider for crypto trading
- Implementing support and resistance levels in your analysis
- Using moving averages to identify trends in the crypto market
- The importance of volume in technical analysis for crypto trading
- Combining technical analysis with fundamental analysis for better trading decisions
Understanding the basics of technical analysis
Technical analysis is a method used by traders to evaluate investments and identify trading opportunities by analyzing statistical trends gathered from trading activity, such as price movement and volume. By understanding the basics of technical analysis, traders can make more informed decisions when trading cryptocurrencies.
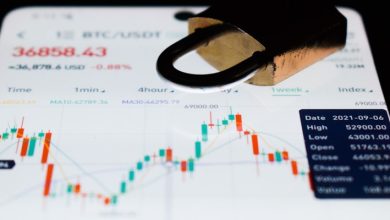
One fundamental concept in technical analysis is the use of charts to visualize historical price data. These charts can help traders identify patterns and trends that may indicate potential future price movements. Common types of charts used in technical analysis include line charts, bar charts, and candlestick charts.
Another key aspect of technical analysis is the use of indicators. Indicators are mathematical calculations based on price, volume, or open interest that can help traders predict future price movements. Some popular indicators used in technical analysis include moving averages, relative strength index (RSI), and Bollinger Bands.
It is important for traders to understand that technical analysis is not foolproof and should be used in conjunction with other forms of analysis, such as fundamental analysis. By combining different analytical methods, traders can make more well-rounded trading decisions.
Key technical indicators to consider for crypto trading
When it comes to crypto trading, there are several key technical indicators that traders should consider to make informed decisions. These indicators can help traders analyze price trends, identify potential entry and exit points, and manage risk effectively. Here are some of the most important technical indicators to keep in mind:
- Relative Strength Index (RSI): The RSI is a momentum oscillator that measures the speed and change of price movements. It can help traders determine whether a particular cryptocurrency is overbought or oversold, which can signal potential trend reversals.
- Moving Averages: Moving averages are used to smooth out price data and identify trends over a specific period of time. Traders often look at the relationship between short-term moving averages (e.g., 50-day) and long-term moving averages (e.g., 200-day) to gauge the strength of a trend.
- Bollinger Bands: Bollinger Bands consist of a simple moving average and two standard deviations plotted above and below the moving average. They can help traders identify volatility and potential price breakouts.
- MACD (Moving Average Convergence Divergence): The MACD is a trend-following momentum indicator that shows the relationship between two moving averages of a security’s price. Traders often use the MACD to identify changes in trend direction.
- Fibonacci Retracement: Fibonacci retracement levels are horizontal lines that indicate where support and resistance are likely to occur. Traders use these levels to identify potential entry and exit points based on the Fibonacci sequence.
By incorporating these technical indicators into their crypto trading strategy, traders can gain valuable insights into market trends and make more informed decisions. It’s important to remember that no single indicator can guarantee success, so it’s essential to use a combination of indicators and tools to analyze the market effectively.
Implementing support and resistance levels in your analysis
Implementing **support and resistance levels** in your analysis is crucial for successful **crypto trading**. These levels are **key price points** where a **cryptocurrency** is likely to experience **buying or selling pressure**. By **identifying and analyzing** these levels, **traders** can make **informed decisions** on when to enter or exit a trade.
One way to **determine support and resistance levels** is to **look at historical price data**. **Chart patterns** such as **double tops**, **head and shoulders**, and **triangles** can help **identify these levels**. **Technical indicators** like **moving averages** and **Bollinger Bands** can also be used to **confirm** these **levels**.
When **support levels** are **broken**, they often become **resistance levels**, and vice versa. **Traders** can use this **information** to **anticipate price movements** and **set stop-loss orders** to **manage risk**. **Support and resistance levels** can also be used to **set profit targets** and **determine optimal entry and exit points**.
In conclusion, **incorporating support and resistance levels** into your **technical analysis** can greatly **improve your trading**. By **understanding** these **key price levels**, **traders** can make **more informed decisions** and **increase their chances** of **success** in the **crypto market**.
Using moving averages to identify trends in the crypto market
One of the most popular technical analysis tools used in crypto trading is moving averages. Moving averages help traders identify trends in the market by smoothing out price data over a specific period of time. By analyzing the relationship between short-term and long-term moving averages, traders can gain insights into the direction of the market.
Short-term moving averages, such as the 20-day or 50-day moving average, react quickly to price changes and are useful for identifying short-term trends. On the other hand, long-term moving averages, like the 100-day or 200-day moving average, provide a broader view of the market and are helpful in identifying long-term trends.
When the short-term moving average crosses above the long-term moving average, it is considered a bullish signal, indicating that the price is likely to continue rising. Conversely, when the short-term moving average crosses below the long-term moving average, it is seen as a bearish signal, suggesting that the price may decline.
Traders can use moving averages to confirm the strength of a trend or to identify potential trend reversals. By paying attention to crossovers and the relationship between different moving averages, traders can make more informed decisions when trading cryptocurrencies.
The importance of volume in technical analysis for crypto trading
Volume is a crucial aspect of technical analysis when it comes to trading cryptocurrencies. It refers to the number of tokens or coins that are being traded within a specific period. Understanding the volume can provide valuable insights into the market sentiment and help traders make informed decisions.
High volume typically indicates strong interest in a particular cryptocurrency, suggesting that a significant price movement may be imminent. On the other hand, low volume could signal a lack of interest or uncertainty among traders, leading to potential price stagnation or even a reversal.
By analyzing volume trends, traders can confirm the strength of a price movement or identify potential trend reversals. For example, a price increase accompanied by high volume is more likely to be sustainable compared to one with low volume. Similarly, a decrease in price combined with high volume could indicate a strong downtrend.
It is essential to consider volume alongside other technical indicators to get a comprehensive view of the market. Combining volume analysis with tools such as moving averages, relative strength index (RSI), and MACD can help traders make more accurate predictions and improve their overall trading strategy.
Combining technical analysis with fundamental analysis for better trading decisions
Combining technical analysis with fundamental analysis can lead to more informed trading decisions in the crypto market. While technical analysis focuses on price movements and chart patterns, fundamental analysis looks at the underlying value of a cryptocurrency. By using both approaches, traders can gain a more comprehensive understanding of the market and make better investment choices.